Empowa's $EMP release schedule

One of the more exciting projects announced on the Cardano blockchain is Empowa. The goal of the project is to facilitate decentralized funding for building houses in Africa. Their native token $EMP will be used to fund these homes by locking tokens, giving investors rent payments in return over the locked period. The Empowa ISPO is currently live, with a public sale planned later this year.
With the public sale coming closer, you as an investor might be interested in the vesting period of the $EMP token and its future circulation supply. In this article an overview of the different vesting periods is given, as well as a comparison of the possible price of the token given a certain market cap.
Disclaimer: The tokenomics provided by Empowa are not definitive. Changes to the tokenomic may change and make the information in this article obsolete. This article is written because I like to play with spreadsheets and thought you might enjoy it as well. It is in no way financial advice.
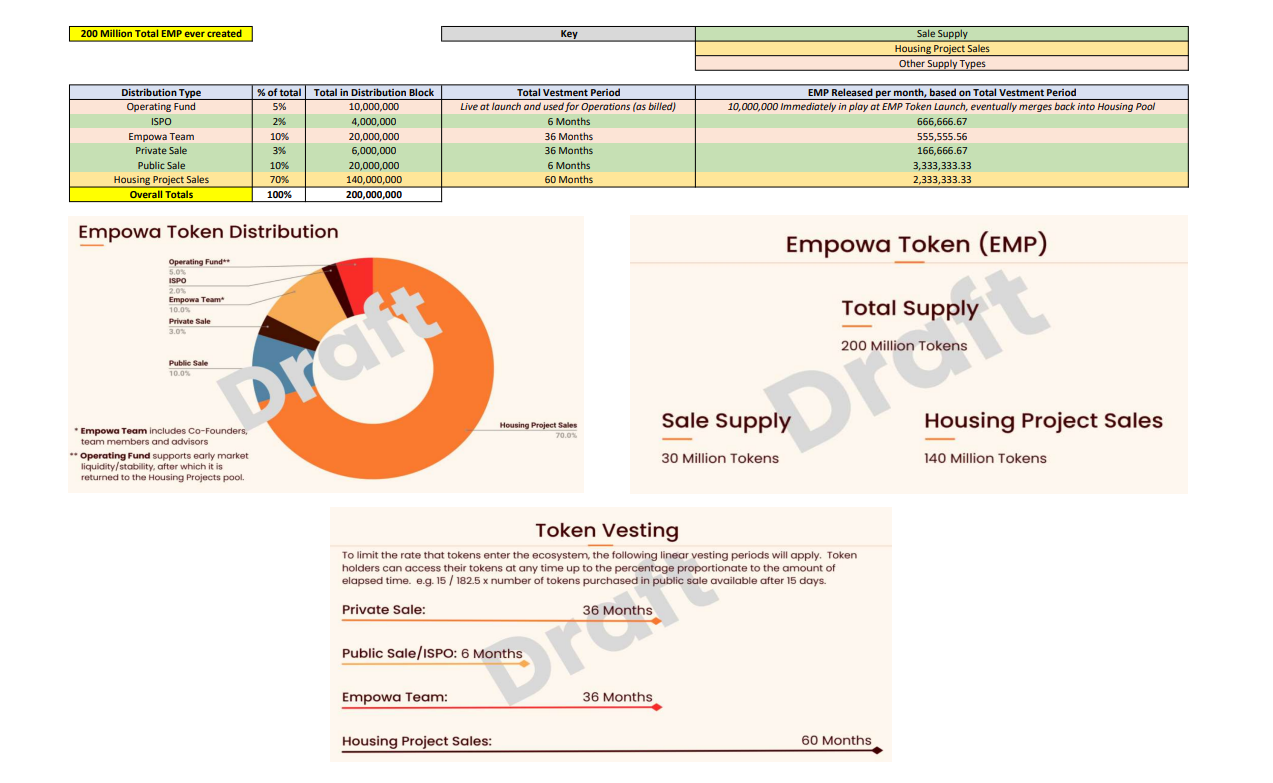
The total token supply of 200 million will be divided into six different categories,
each with their own vesting periods. The categories are explained in short by the infographic below, made by Empowa telegram group moderator Johnny Kelly (many thanks). (see Figure 1) For further details, please see the tokenomics available at https://empowa.io/token/ . The total amount of $EMP will be released over a period of 5 years, with just over 25% releasing in the first six months. (see Table 1) As illustrated in Figure 2, the biggest part of the $EMP in circulation at the start will be the operating fund, aimed at providing liquidity. As time goes on, the $EMP allocated to the housing project sales will become the biggest.
Figure 1: Overview of the $EMP vesting periods.
Credits: @intertreeEMP on twitter (Table) and Empowa draft tokenomic (Slides)
Table 1: $EMP in circulation over the first 3 years.
Figure 2: Vesting of $EMP tokens per category visualised.
Given the vesting period, tokens in circulation and market cap of other crypto projects, we can calculate a possible price for $EMP. (see Table 2 & 3) However, this calculation is based on current marketcaps (15 november 2021) and is pure speculation.
To reiterate, I like to put numbers onto spreadsheets and I am not in any way, shape or form giving financial advice. That being said, I personally really like Empowa and am planning to invest in their public sale. I hope you enjoyed this short article and are prompted to do your own follow-up research!
Table 2: $EMP price based on a circulation of 53 million tokens (6 months after release) and the market cap provided by coinmarketcap.com on 15 november 2021.
Table 2: $EMP price based on a circulation of 71 million tokens (12 months after release) and the market cap provided by coinmarketcap.com on 15 november 2021.

Comments
Post a Comment